Picture 1 of 11


Gallery
Picture 1 of 11


Have one to sell?
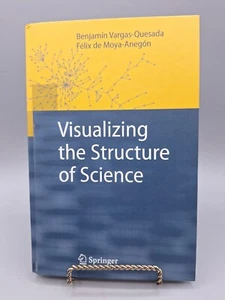
Visualizing the Structure of Science by Benjamin Vargas-Quesada ~ Hardcover
US $32.99
ApproximatelyRM 140.16
Condition:
Like New
A book in excellent condition. Cover is shiny and undamaged, and the dust jacket is included for hard covers. No missing or damaged pages, no creases or tears, and no underlining/highlighting of text or writing in the margins. May be very minimal identifying marks on the inside cover. Very minimal wear and tear.
Oops! Looks like we're having trouble connecting to our server.
Refresh your browser window to try again.
Shipping:
US $5.22 (approx RM 22.18) USPS Media MailTM.
Located in: Longview, Texas, United States
Delivery:
Estimated between Wed, 23 Jul and Tue, 29 Jul to 94104
Returns:
No returns accepted.
Coverage:
Read item description or contact seller for details. See all detailsSee all details on coverage
(Not eligible for eBay purchase protection programmes)
Seller assumes all responsibility for this listing.
eBay item number:388296142243
Item specifics
- Condition
- Book Title
- Visualizing the Structure of Science
- ISBN-13
- 9783540697275
- ISBN
- 9783540697275
About this product
Product Identifiers
Publisher
Springer Berlin / Heidelberg
ISBN-10
3540697276
ISBN-13
9783540697275
eBay Product ID (ePID)
59114007
Product Key Features
Number of Pages
VIII, 312 Pages
Language
English
Publication Name
Visualizing the Structure of Science
Publication Year
2007
Subject
Philosophy & Social Aspects, User Interfaces, Research & Methodology, Social Aspects / Human-Computer Interaction
Type
Textbook
Subject Area
Computers, Science
Format
Hardcover
Dimensions
Item Weight
22.8 Oz
Item Length
9.3 in
Item Width
6.1 in
Additional Product Features
Intended Audience
Scholarly & Professional
Reviews
From the reviews: "Numerous aspects of the book are unequivocally so new ... . Just about anyone involved in Information Technology and Documentation Sciences will be fascinated by this new approach ... . The well-stocked Bibliography will permit novices an easy entry into this new research field ... . The book's excellent overview of a difficult subject matter is highly recommended to experts. ... the philosophy, methodology, technology, science and pedagogy presented are unique and important! To the authors: congratulations!" (Karl H. Wolf, International Journal of General Systems, 2008), From the reviews:"Numerous aspects of the book are unequivocally so new … . Just about anyone involved in Information Technology and Documentation Sciences will be fascinated by this new approach … . The well-stocked Bibliography will permit novices an easy entry into this new research field … . The book's excellent overview of a difficult subject matter is highly recommended to experts. … the philosophy, methodology, technology, science and pedagogy presented are unique and important! To the authors: congratulations!" (Karl H. Wolf, International Journal of General Systems, 2008)
Number of Volumes
1 vol.
Illustrated
Yes
Dewey Decimal
658.514
Table Of Content
Visualization.- Visualization of Scientific Information and Domain Analysis.- Methodological Aspects Previous to Scientography.- Material Used.- Methodology.- Results.- Discussion.- Epilogue.
Synopsis
Constructing a great map of the sciences has been a persistent dream since the Middle Ages. In modern times this need has become even more urgent because of the requirement to combine and link research in adjacent areas, often resulting in new disciplines such as bioinformatics and nanotechnologies. Computer visualization helps humans to perceive and understand large and complex structures, such as molecular structures or data dependencies. Vargas-Quesada and Moya-Anegón propose a methodology for visualizing large scientific domains. They create science maps, so-called "scientograms", based on the interactions between authors and their papers through citations and co-citations, using approaches such as domain analysis, social networks, cluster analysis and pathfinder networks. The resulting scientograms offer manifold possibilities. Domain analysts can discover the most significant connections between categories of a given domain, and they can also see how these categories are grouped into major thematic areas and how they are interrelated through a logical internal, while information scientists or researchers new to an area may appreciate a durable image of the essential structure of a domain., This book presents a methodology for visualizing large scientific domains. Authors Moya-Anegón and Vargas-Queseda create science maps, so-called "scientograms", based on the interactions between authors and their papers through citations and co-citations, using approaches such as domain analysis, social networks, cluster analysis and pathfinder networks. The resulting scientograms offer manifold possibilities., This book presents a methodology for visualizing large scientific domains. Authors Moya-Aneg n and Vargas-Queseda create science maps, so-called "scientograms", based on the interactions between authors and their papers through citations and co-citations, using approaches such as domain analysis, social networks, cluster analysis and pathfinder networks. The resulting scientograms offer manifold possibilities.
LC Classification Number
QA76.9.U83
Item description from the seller
Seller feedback (982)
- i***e (2633)- Feedback left by buyer.Past monthVerified purchaseExcellent seller. Pleased with purchase.
- 8***5 (4)- Feedback left by buyer.Past monthVerified purchaseBook was in excellent condition
- r***b (525)- Feedback left by buyer.Past monthVerified purchaseSeller is great fast shipping and good prices! Book is awesome, very small and easy to carry to self-study! Well, some few notes with ink inside take out value to the book, but, in general is clean! My positive feedback! Thanks! Very well packaging!
More to explore :
- Science Fiction Fiction Hardcovers Books,
- Computer Science Hardcover Textbooks,
- Science Hardcover Nonfiction Books,
- Fiction Hardcover Mario Vargas Llosa & Books,
- Science Study Hardcovers Prep,
- Science & Medicine Earth Science Hardcover Antiquarian & Collectible Books,
- Science Fiction Fiction Hardcovers Books with Vintage,
- Star Wars Science Fiction Fiction Hardcovers Books,
- Science Fiction Fiction Hardcovers Books in English,
- Science Natural Disasters Hardcover Books in English